Data and tools for electric utilities

Know where your utility stands.

Emphasis Energy turns the public data every utility files with the federal government into benchmarks, learning, and tools people want to use. Leadership sets better goals. Employees understand the industry they work in, and get excited about it.

900+ U.S. distribution utilities in our datasets
180+ metrics benchmarked across territory, rates, reliability, and generation
2 products ready today, and custom tools built on the same data
Residential rate · ¢ per kWh 2024 averages
Your co-op
12.4¢
Neighbors
13.4¢
State co-ops
14.8¢
National co-ops
13.8¢
Your cooperative Neighbors Reference
SAIDI · monthly minutes (12 mo.) vs. state median
01 — The problem

Most utilities aren't using the data that could define their strategy.

The data that benchmarks your rates, your reliability, your territory's economic health, and your growth against every utility in the country is publicly available, but very few utilities use it. The ones that do track metrics benchmark against a handful of neighbors, which means they measure progress without the full picture.

02 — Our approach

We help utilities become strategically focused organizations.

Emphasis Energy puts industry data in front of every employee, from the executive team to the front line, and builds a culture where people understand their utility's performance, know how it compares to peers, set better goals, and care about what comes next.

03 — In practice

What that looks like in practice.

New employees leave onboarding with years of institutional knowledge compressed into a single experience, understanding their utility's customers, territory, reliability, rates, and generation landscape through real data benchmarked against peers. Long-tenured employees see the bigger picture they've been working inside for years. Leadership gains a shared language with their team, built around the numbers that actually matter. And the same data goes home with people in their pocket.
Two products, ready today

One data foundation. Two ways to put it in people's hands.

Both started as tools built for one utility. The Platform teaches a cooperative's employees their own business through benchmarked data. The iPhone app puts the same public plant and utility data in anyone's pocket.

For cooperative employees

Co-op Knowledge Platform

Five sequenced learning modules, each paired with a live dashboard of your cooperative's data benchmarked against state peers, neighbors, and national averages. Employees read the concept, learn the terms, study the numbers, and pass a quiz to unlock the next module.

  • Microsoft work sign-in
  • Power BI dashboards
  • 5 modules with quizzes
  • Whole-organization access
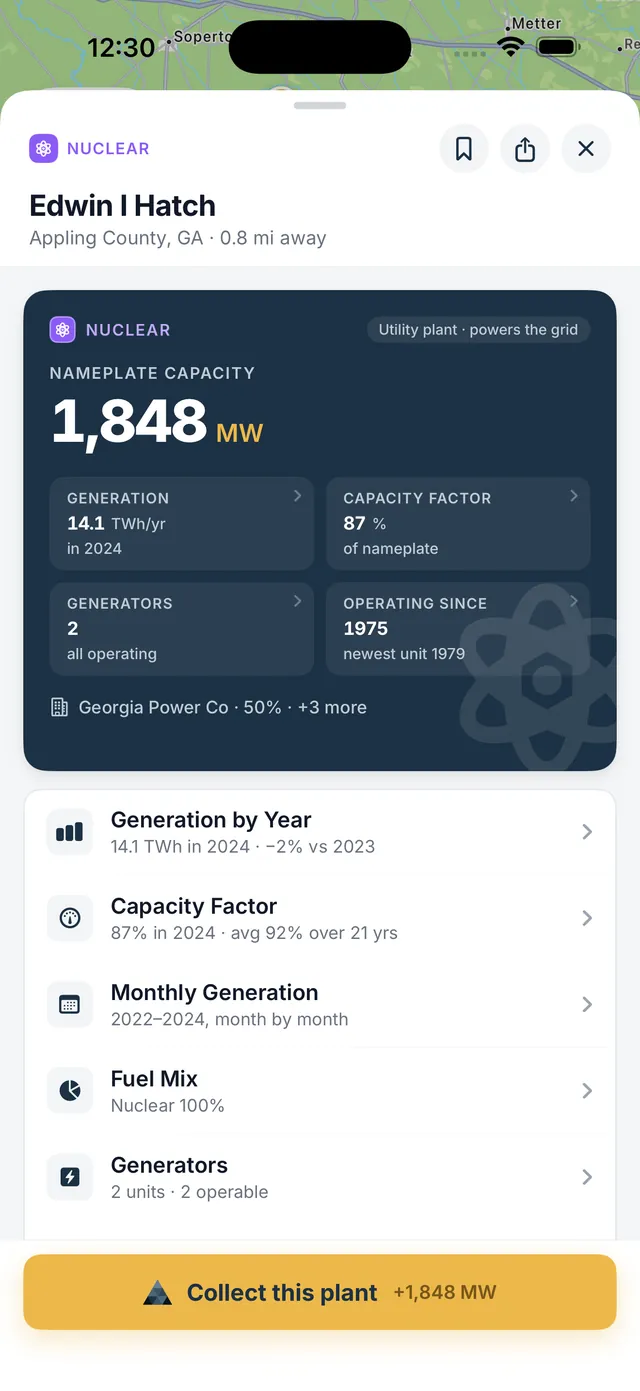
Phone showing a plant card for a nuclear plant with its capacity, capacity factor, and a Collect this plant button.
For anyone with an iPhone

Emphasis Energy for iPhone

Every power plant and electric utility in the U.S. on a map, with the data they report to the federal government each year. See what a plant generates, what your utility charges against the state and the country, and how your state ranks. Visit a plant and collect it.

  • Free to browse
  • Emphasis Pro $12.99 a year
  • No ads, no tracking
  • iOS 17 or later
Custom tools

These two are examples. The next one can be yours.

The same data and the same design can become a benchmark report for your board, a training module for a new line crew, or a tool nobody has built yet. Tell us the question your team keeps asking, and we will build the thing that answers it.

What we benchmark

Five dimensions of utility performance, all from public data.

Every metric is sourced from public data sources — EIA, Census, USDA, AFDC — cleaned, normalized, and benchmarked against the peer set that you choose.

The Core Business

Customer growth, kWh sales, and rate comparisons across residential, commercial, and industrial classes. See the big picture with 15+ years of data.

Service territory

Population, demographic composition, economic indicators, and poverty stats — compared to every peer utility in your state and footprint.

Reliability

SAIDI, CAIDI, and SAIFI with and without major event days gives you a clear picture into trends in outages and reliability around the country.

Generation landscape

Your state's resource mix, regional grid context, and the transitions already in motion around you.

EVs & emerging load

EV adoption trends, charging-station density in your territory, and the load-shape implications you'll want to understand before they show up on the system.

Outcomes

A data literate utility with a strong sense of direction.

Utilities that work with us put data in front of their people, then get back to running the business, with sharper conversations and fewer surprises.

  • Onboarding that compresses years of institutional knowledge into weeks.
  • Board and executive conversations that start from peer-benchmarked facts.
  • Strategic planning grounded in long-term trends from across the industry.
  • A workforce that understands what the utility is, what it's for, and what's coming.
Inside the rollout

From kickoff to confident conversations.

  1. 01
    Week one — your data is live. SSO with your email domain, dashboards and learning content loaded with your cooperative's data, ready to explore and compare to others around the country.
  2. 02
    Modules build the foundation. Five sequenced modules walk every employee through the cooperative business with real data, from the core business to emerging technologies.
  3. 03
    Strategic conversations sharpen. Board, executive, and front-line discussions start from the same peer-benchmarked facts — not internal anecdote.
Get in touch

See how your utility compares.

We'll walk you through your own benchmark report, show you both products, and talk about what a tool built for your utility could look like.